Stephen R. Heller
Heuristics Laboratory,
Division of Computer Research and
Technology,
National Institutes of Health,
Public Health Service, Bethesda, Md. 20014
ABSTRACT
An interactive, conversational mass spectral retrieval system consisting of a collection of computer programs designed to give immediate retrieval of mass spectral data is described. The system options include a peak/intensity search, a molecular weight search, a complete molecular formula search, an imbedded molecular formula search, and printout of the peaks and intensities of the entire spectrum. The programs used to generate and search the files, as well as the file structure, are described.
Of all the physical Data available to the organic chemist, mass spectral data are the most readily compatible with the computer. In particular, the so called "low resolution" mass spectra, with peaks at unit mass intervals, are widely available in large numbers and of great value in structural elucidation. Furthermore, when only very small samples of the material are available, such as from a gas chromatograph, the mass spectrum may be the best available information for use in the determination of the structure of the unknown chemical.
A number of investigators (1-7) have developed methods for processing and searching mass spectral data. None of the current methods, however, includes an interactive search capability in which the bench chemist can modify his demands while the search is under way. Our experience in the development of a Chemical Information System (8) has led us to the conclusion that computer programs should be highly interactive, conversational, and available over ordinary telephone lines from the chemist's lab.
The system is designed to be used for both routine identification and for assistance in the determination of unknown structures. The programs described here are used daily and routinely from laboratories at NIH. The programs give virtually instantaneous response at the chemist's teletype. In addition, an extensive user's manual is available which describes how the program is used and gives numerous examples of the different types of searches possible with the system (9).
The philosophy behind the development of the system was to design
programs that respond rapidly to the chemist's query directly
from his lab and that stimulate his consideration of the next
logical response. The data file being used in the search program
is the same file as used by Hertz, Hites, and Biemann (7), and
was kindly made available by the authors. In this method of
spectral data abbreviation, the most intense peaks in each
interval of fourteen mass units are selected from the complete
spectrum for matching. Other methods include using n peaks per m
interval, where n and m are other than 2 and 14, as well as the
technique of selecting five to ten of the largest peaks from the
spectrum irrespective of mass value. The abbreviated (or
compressed) spectrum used here has the virtue of following the
chemist's thought pattern analysis, which is to look for patterns
and peak clusters. For example, a difference of fourteen emu
(CH2) between groupings indicates the presence of straight chain
molecules. Indeed, the choice of a search interval of fourteen
emu was specifically made so that the computer would give a
homologous series of ions the same relative importance as a
chemist would give the series of ions
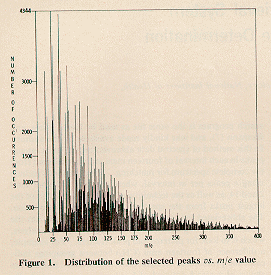
Figure I shows the
distribution of the abbreviated spectra as a function of m/e
value. Normally the low mass region contains many intense peaks
and the above method of selection clearly discriminates against
ions in this region. The main reasons for compressing or
abbreviating spectra have been the storage limitations and the
speed of the search system. Third and fourth generation computers
with vast on-line storage capacity (being shared by many users in
a time-shared computer) as well as increased speed make these
reasons less valid. In addition, a well structured file can improve the "apparent" speed of the program. While the system
described here does use an abbreviated spectrum, it does not
appear to be necessary, and, indeed, does prove costly in the
time needed for the selection of the peaks that constitute the
abbreviated spectrum, as well as the loss of some information.
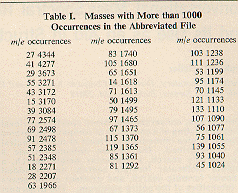
Those masses with more than 1000 occurrences in the selected file
are shown in
Table I.
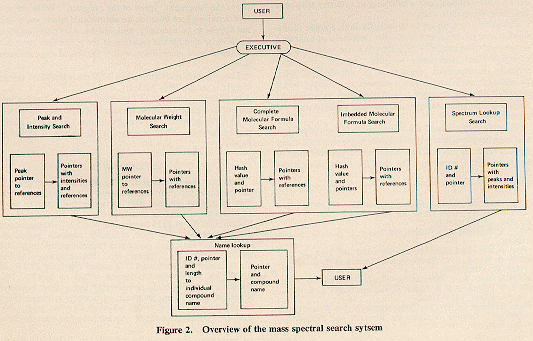
In addition to a peak and intensity search, it was felt that molecular weight and molecular formula searches would also be of value in both structural elucidation and routine identification problems. An overview of the system is shown in Figure 2.
EXPERIMENTAL
Peak and Intensity Search. The main search program in the system
is the peak and intensity search program. The data base being
searched uses the two largest peaks in every 14 m/e interval,
starting at m/e of 6 (i.e., 6-19, 20-33, etc.). The original file
of 8124 spectra contained 762,162 peaks and their intensities.
The first computer program pulled or selected the two largest
peaks and their intensities in 14 m/e intervals from the original
file. The resulting 185,396 peaks (ranging from 9 to 133n pulled
represent 24.3% of the file vs. a theoretical reduction of 1/7 or
14.4%. The reason for the file being considerably larger than
expected is that in many 14 m/e intervals, particularly at higher
mass values, there are considerably less than fourteen peaks and,
thus, the two largest must be selected from less than fourteen
possibilities.
It might logically be assumed that the proper way for the chemist
to enter data from an unknown mass spectrum would be to similarly
select, beginning at m/e 6, the two most intense peaks in each
fourteen emu. Specifically, selection of more than two peaks
within fourteen emu is dangerous, unless the fourteen emu
crossover point has been located by ticking off the spectrum
beginning at m/e 6. In practice, it is unnecessary to stress this
point, because real mass spectra usually have their peaks more
uniformly distributed according to mass. An important case where
an error might be introduced is in spectra where the fragment ion
is so intense as to require inclusion of its '~C satellite in the
abbreviated spectrum. In such a case, another important fragment
occurring within fourteen emu would be overlooked. After the
peaks were sorted by increasing mass (m/e value), the next
program took each mass and the list of references (i.e., spectrum
ID numbers) and generated a disk file of the m/e values with
pointers to a second disk file containing the references to these
m/e values.
It will be helpful to describe some details of the file structure
for a dear understanding of the search and retrieval method. The
first disk file is the pointer file and contains a cell (being
one computer word) for each m/e value up to 1337. The second disk
file is the reference file, which contains the references or ID
numbers associated with a given m/e value. At the beginning of
the file generation all the cells in both files contain a --1. As
the generation program proceeds, if there are any references at a
given m/e, the--1 in the cell or word of the pointer file is
replaced by a pointer number. At the same time, the references
(in this case, the ID number and the intensity of the peak with
the ID number packed together into one 36-bit computer word) are
being sequentially put into the disk reference file, one at a
time. After all the references for a particular m/e value are put
in the file, the next word is left as--I to indicate a breakpoint
between reference lists. The pointer number system works quite
simply. The first peak found in the file is at m/e 9. There are
three references to this value. The next peak is at m/e 10. There
are four references to this value. In cell 9 the program stores
the value 1, indicating that entries for this m/c value exist. In
cell 10 the program stores the value five, which is the previous
pointer value + number of references at the previous m/e value +
I for the breakpoint cell between references, which is I + 3 + I
= 5. In cell 11, the program stores the value 10 (5 + 4 + 1). To
find the number of references that contain m/c 10, one simply
goes to the 10th cell, and since it is not --1, then proceeds to
subtract the value m cell 10 (5) from the value in cell 11 (10)
minus one. Thus, the value in cell 10 tells one where in the
reference file the ID numbers and intensities are.
In the PDP-10 computer, the basic disk file unit is a block of
128 36-bit computer words. Therefore, to find the location of the
reference to m/c 10, one must go to block ((mass-- 1)/128) + 1,
which is 1 in the case of m/c = 10. Because a block number must
be an integer, the block number is found by a computer technique
called integer divide. Integer divide simply truncates any
fractional part of a number. Thus 8/3 is 2 and not 3, and 10/128
or 100/128 or 1/128 are all 0. In block 1, one then proceeds to
word: module (cell in value--1,128) + 1 = module (4,128) + 1 = 4
+ 1 = 5. The module function or operation of module (a,b) is
defined as a--(a/b)a, where a/b is an integer division. Also, in
the computer, the division is performed before the multiplication, so that when a is a number from 1 to 127, and b is 128,
a/b will always be 0. The next cells are read until a cell
containing a -- I is encountered, which indicates the end of that
list of references. Thus the file structure is as simple to
generate and understand as it is rapid in its retrieval of the
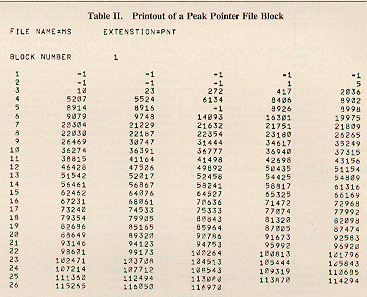
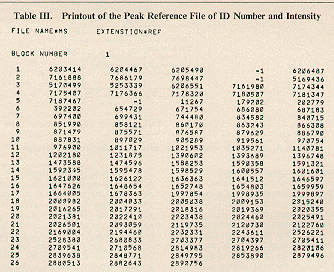
data. Printouts of the first block of the peak pointer file and
the first block of the peak reference file are presented in
Tables II and
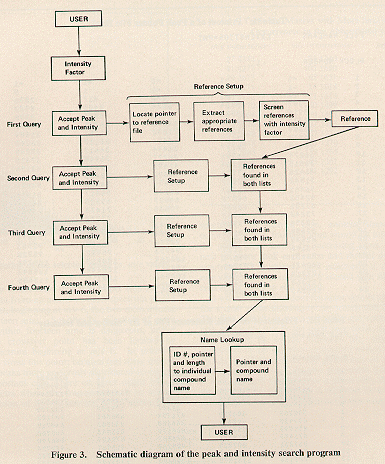
III. A schematic diagram of the peak and intensity
search program is shown in
Figure 3.
One feature considered a necessity was the ability to filter out
masses with intensities very different from the intensity of the
unknown mass or to look selectively at certain masses e.g., the
base peak (relative intensity 100.0%) at a given m/e value].
Rather than having a fixed intensity factor filter, such as
allowing the largest peak in the unknown to be up to 25% larger or
smaller than the known spectrum, the program search begins by
allowing the chemist to select the value he wants. The values of
the intensities of the peaks range from 0 to 100 (i.e., 0.01% to
100.0%). Typically, a factor of 2 - is used. This means that the
intensity values entered into the search program will be multiplied
and divided by this intensity range factor to give a lower and
upper limit for the search. It has been found that for low m/c
values, lower intensity factors should be used for two reasons.
First, the intensity variations between instruments at a low m/e
(~100) are much less than at high m/e values. Second, there are
many more peaks at lower m/e values and the filtering will speed up
the search and present fewer answers of little value. The intensity
range factor can be used in a number of ways. If a factor of 1 is
used with a peak intensity of 100, only those spectra with this ion
as their base peak will be obtained. On the other hand, if the
range factor is 100 or greater, then there will be no intensity
filtering because any intensity divided by 100 will include the
range of 0 to 100. A range factor of 2 and an intensity of 150
(150~070) will allow only peaks with an intensity greater than 75
(75%) to be considered. Thus, the variable intensity filter allows
the chemist to experiment with the system as he searches, and
provides a very important psychological factor in obtaining the
acceptance of the search system in the laboratory. The range factor
value decision is made at the start of the search and is held
constant for all peaks entered and considered in that search. It
would be a simple matter to modify the factor for each peak, but
the additional decision required at each step in the search was
considered to be more annoyance than it was worth. Note also that
the multiplication/division by an integer implies very wide range
factors, i.e., increasing and decreasing intensities by as little
as 90% is not permitted (0.9 is a non-integer value). In this
system, as contrasted with some other available (6,7), we are
looking for an answer or series of suggestions after an input of
two to three peaks, rather than the "degree of fit" or "similarity
index" of the entire spectrum with one on file. The rationale
behind this approach is that quite often the required spectrum will
not be in the file, but the spectrum of a similar substance, also
exhibiting the peaks in question, may be. If such a near-hit is
found, it has been our experience that the chemist is willing to
perform the necessary mental gymnastics to extrapolate to a correct
conclusion.
After the chemist gives the program the intensity range factor, the
program begins to ask for peaks and intensities, one peak and
intensity at a time. After the chemist enters each request, the
program responds with the total number of peaks in the file at that
m/e value, and with the number of spectra that pass the intensity
filter. In this manner, the chemist can obtain some idea of the
size of partial file resembling his unknown at the same time he is
tailoring the search to his own needs. After the chemist has
entered the second peak and intensity, and for all peaks and
intensities thereafter, the program automatically finds all those
spectra that contain that combination of peaks and intensities. If
no spectra are found to contain the combination of peaks and
intensities, the program responds with this fact and allows the
chemist to go back to the previous set of references found, so that
he may obtain a listing of those ID numbers and names. Then the
program automatically starts at the beginning again, with a request
for a new intensity factor. At any point along the way, the chemist
has the option of printing the ID number and name of those
compounds meeting the current criteria of peaks and intensities. To
increase the possibility of reaching a useful result earlier, it is
generally best to enter the highest masses first, since the number
of peaks at the high masses tend to be smaller. This is
satisfactory, provided that the compound is in the file, but if it
is not in the file, this search method may fail to locate an
interesting lower homolog or related compound with a similar mass
spectral fragmentation pattern. In fact, it is often quite useful
to add or subtract 14, or even 28, m/e units to the series under
consideration. In general, an average search will take from five to
fifteen minutes time at a computer terminal, although with some
experience with the system, a search can take as little as two
minutes.
At the present time, the program accepts up to twenty-five peaks
and intensities, although it could be readily expanded to one
hundred or more. However, it has been the experience of the
chemists using the system that two or three pertinent peaks.will
narrow down the possibilities very rapidly. Of course, the
judgment of many years of experience goes into the choice of the
peaks which the chemist selects for entry into the search
program. If one enters a peak and intensity which results in no
spectra in the file with that combination of peaks and
intensities, it is possible to go back and produce the previous
references or to go back one step and continue on.
An example of the search program is shown in Figure 4. In this example, a sample of blood from a drug overdose patient at a local hospital was put through a GC-MS system, and three peaks from the resulting mass spectrum were entered into the search program. Of the possible compounds found from the search, it was immediately clear that thymol (2-isopropyl-5-methyl phenol) was the most reasonable possibility. Thymol is a common flavoring agent and, while not harmful in itself, correctly suggested that an excess of a common cough syrup had been ingested.
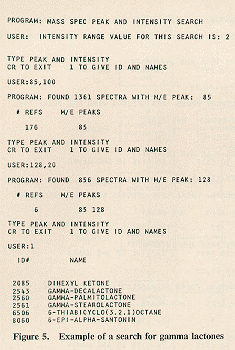
Figure 5 is a sample search of a component isolated from a secretion from a rove beetle, Bledius mandibularis. In Figure 5, the search program did not find an exact match, but the resulting list of possibilities included a number of gamma lactones (the C11, C16, and C18 and the lactone with ID number 8060). The similarity of the unknown with the gamma lactone spectra indicated the probability/hat the unknown was a related gamma lactone. Later, comparison with a known sample of the C12 gamma lactone confirmed the structure and identity of the unknown.
In a search (not shown) for a long-chain hydrocarbon, n-dodecane, which should take a long time since most of its peaks are in common with other compounds in the file, it required only three masses (112, 127, and 170) and 1.08 cpu seconds to narrow the search down to three different molecules, one of which was the correct answer.
The test example again illustrates the use of the file even when the compound is not itself in the file. A chemical constituent in a grape-flavored chewing gum was isolated and found to have major peaks at m/e 151, 119, 92, and 65. However, there were no spectra in the file with these combinations of peaks and similar intensities. After some experimenting, the peaks at m/e 151, 92, and 65 were entered, and the resulting answer, shown in Figure 6, was methyl aminobenzoate. Methyl p-aminobenzoate had major peaks at m/e 151, 120, 92, and 65. This answer suggested that it was quite reasonable to consider the unknown to be the ortho isomer, which lost methanol (CH3OH) and that the pare isomer lost only methoxy (CH3O). Thus, the similarity of the spectra could be explained, as well as the apparent anomaly of the m/e 119 and 120 peaks.
The time required for a search is quite short because of the structure of the file as well as the method of determining which references contain the peaks (with the proper intensities) required by the chemist. A simple algorithm is used to intersect the two lists, one containing the previously found references and the other containing the newly found references. Thus, the lists are scanned to find the highest first reference number. Then using this "Hiref" value, the other list is scanned until either the same number or a number higher than "Hiref" is found. If it is the same number, a match is found and that reference number is stored. If there is no match, but rather a reference number greater than "Hiref" is found, this new higher reference becomes "Hiref" and the scanning of the other lists is continued. This alternate scanning down the lists is very rapid and can be extended to intersect many lists simultaneously. An example of a four-list intersection is given in the imbedment molecular search program.
After the final reference list is obtained, the ID numbers and names of the compounds are printed. The structure and search of the files for the name printout are very similar to those of the peak/intensity file. Starting with the ID number located from the above search, the first disk file serves to locate the starting block and word in the second disk file where the name is actually stored. It is stored in parts, with five characters or letters per computer word. Since the PDP-10 is an ASCII machine with a 36-bit word length and uses 7 bits per character, or 35 bits for five characters, by using the difference between the number in the ID cell subtracted from the number in the ID + 1 cell, the length of name is obtained (in PDP-10 word length, which is 1/5 of the actual length of the name). The computer is thus instructed to print out the number of blocks determined above, from the determined starting point, resulting in the printout of the complete name of the compound.
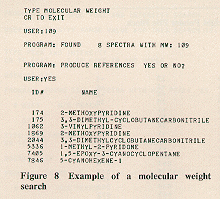
Molecular Weight Search. The molecular weight search
program finds all the references with a given molecular
weight and lists the ID numbers and names, if desired.
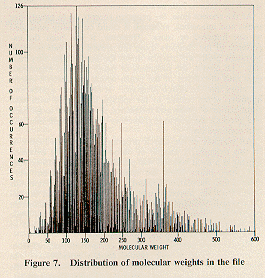
There were 426 different molecular weights in the 8124 spectra,
ranging from 2 to 1318. The distribution of molecular
weights is shown in
Figure 7. The file structure and program
search are again the same as in the peak search program.
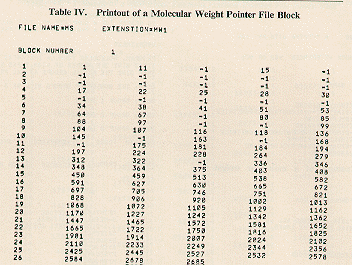
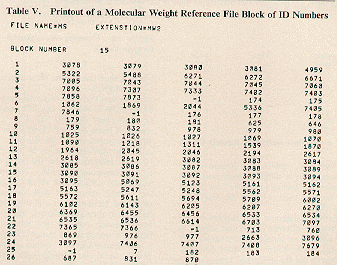
Tables IV and
V are a printout of the actual disk blocks used
in the search for the molecular weight of 109. The l09th
cell in block 1 of the MS.MW1 file indicates whether or not
there are references to the molecular weight of 109 and the
number is found by using the value stored in the 110th cell. The
value in the 110th cell minus the value in the l09th cell minus I
is 8, the number of references for the molecular weight of 109.
From the value in the lO9th cell, which is 1816, it is found that
the references to the molecular weight of 109 are found in block
((1816 - 1)/128) + 1 = 15, at word = Modulo (1816 - 1, 128) + 1 =
24. Again, integer divide is used to find these values. In
Table V,
which is a printout of block 15, the 24th word is 174, the
first reference on the list in
Figure 8. These ID numbers are
then passed into the same name printout program used in the
previous peak/intensity search.
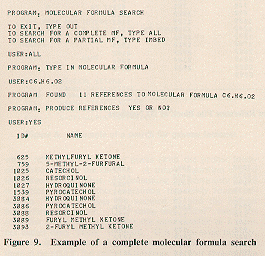
Molecular Formula Set The molecular formula search program is
really two separate programs, one to search for complete
molecular formulas and one to search for partial or imbedded
molecular formulas. The imbedded molecular formula search is
similar to the Hetero Atom In Context (HAIC) Index that Chemical
Abstracts has recently started to issue with every Volume Index.
The complete molecular formula search finds all the references to
a given molecular formula. After the number of references found
is printed, the chemist has the option of obtaining a printout of
the ID numbers and names of the references. Of the 8124
components of the file, there were 2264 different molecular
formulas.
The file structure for the complete molecular formula, as well as
the imbedded molecular formula, is similar to those previously
described, but does have some substantial differences. Dearly a
peak value, a molecular weight, and an ID are all numbers and can
readily be used to give the location or point to a given disk
block and word or cell within that block. However, molecular
formulas are essentially characters and, thus, a different
technique must be used to put the molecular formula "values" on a
disk file for retrieval. The method used is called the hash table
method, or hash coding (10).
The hashing results in the assignment of a number to any
character string. Although different molecular formulas may
produce the same number or numerical key-value, such "collisions"
are rare, and can be handled without difficulty. This enables the
program to use the numerical key-value the same way the peak
value, molecular weight value, and ID number were used previously
to address directly a given block and a given cell within that
block. Thus, for example, the molecular formula string Ar, when
put through the hash function, results in the numeric key-value:
4682565. The module arguments used to find the block and cell
values are a bit more complex for the hash Me because of factors
such as the size of the hash Me and the size of the cell. In
contrast to the peak and molecular weight files, which use only
one word per cell, in the hash file each cell is two words, one
for the numeric key-value, and the second for the pointer value
for the second file. The block containing the numeric key-value
is found by first taking modulo(hval, blkval), where hval is the
numeric key-value and blkval is the size (in PDP-10 128 word
blocks) of the hash file on the disk (in this case 4096 blocks).
The result of this is a number, Val, which is then used in the
second module calculation of Block = modulo(Val + 1),64 + 1. The
value of 64 and not 128 is used because there are two rods per
cell, not one, but the size of the PDP-10 block is still 128
words. The record is found in word (mod (Val,64) *2) + 1. This
value results in a search of block 6, word 13, which is found to
have the value 4682565 stored in it. In the next word of this
two-word cell is the pointer value (1) to locate the block (l)
and word (1) in the reference file for the list of references
corresponding to that molecular formula. The method used here to
take account of collisions is to check the numeric key-value at
the address cell found with the numeric-key-value of the
molecular formula hash. If they are the same, everything is fine,
but if they are different, the program simply looks into the
following cells for the numeric key-value until either there is a
match of the numeric key-values or one encounters a cell
containing --1 values. Finding --1 values shows that the molecular
formula is not in the file.
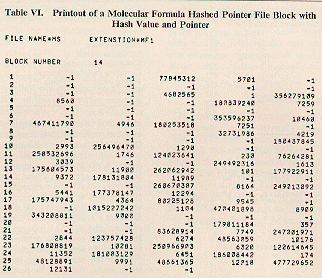
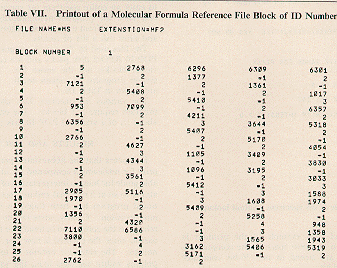
Tables VI and
VII are printouts of the blocks referred to above.
Note that in this case each cell is two words instead of being a
one-word cell as in the peak, molecular weight, and ID files. In
addition, it is necessary to store the number of references found
in the first word in the list in the reference file because there
is no meaning to taking a difference between two numeric key-values in the hash Me. Thus, in block 1, word 4 the value of 5 -
1 = 4 is the number of Ar spectra and the next 4 words contain
the ID numbers to those references. Again a value of--I indicates
that the list of references for that particular formula is
finished. After picking up the ID numbers, they are passed to the
same name printout program described previously.
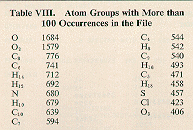
The partial or imbedment molecular formula search finds those compounds containing the given combination of atom groups. For example, a search for all compounds containing the two atom groups C6 and H6 would be found in C6H6 as well as C6H6NO2. C6H6)2, etc. A search for all C6 and all H6 atom groups will usually give rise to a greater number of references than will a search for just C6H6. A search for a C and H4 compounds will result in the program finding methane (CH4) and also methanol (CH4O) and methane thiol (CH4S). Examples of the two search programs are shown in Figures 9 and 10. In breaking down the 8124 complete molecular formulas, there were 23,499 partial formulas generated, of which 208 were different. The atom groups occurring more than 400 times (with their frequency of occurrences) are shown in Table VIII
The imbedment molecular formula search program combines the
methods used in all the previous programs. The program accepts
each of the atom groups (with a current arbitrary limitation of
four groups) and then performs a hash table lookup for each,
finds the references, and stores them on disk files. Then the
previously described list intersection program is used to
determine those references common to an the atom groups entered
by the chemist. The resulting list is then stored on the disk,
for use if the chemist requests a printout of the references
meeting his criteria. Again the name printout program is used to
print out the ID numbers and their corresponding names.
Spectrum Printout. The last of the options in the mass spectral
search system allows a listing of the full or complete spectrum
(not just the two most intense peaks in every 14 m/e interval
used by the peak search program). The file structure for this
program is identical to that of the peak search and molecular
weight search.
Using the ID number found previously in the peak/intensity,
molecular weight, or molecular formula searches, the program
first finds the pointer to the spectrum and the number of peaks
in the spectrum. If the chemist wants a printout, he then has the
option of looking at all the peaks and their intensities or of
looking at only a range of peaks. In addition, there is an option
of listing only peaks above a minimum intensity level. An example
of the printout found in
Figure 11. To conserve space in the
computer, a peak and its intensity are stored in one 36-bit
computer word, each occupying 18 bits.
Computer Programs, Flies, and Times. All of the file generation
and file search programs are written in FORTRAN IV (except for a
few assembly language subroutines) and run on a time-sharing
Digital Equipment Corp. PDP-10. The main memory of the system has
a 1.8-psec cycle time. All of the programs and files are stored on
disk packs. The collection of 8124 spectra was generously provided
by Professor K. Biemann. The reference file contains numerous
duplicates, and no attempt was made to remove any of these. Some
effort has been made to correct errors in the data base; however,
it is felt that the upgrading of the quality of the file will
proceed more rapidly as the system is used by more chemists. There
are approximately 2400 spectra from the ASTM Committee ~14
Subcommittee IV spectrum collection (11), 2000 spectra from the Dow
Chemical Company (12), 1800 from the American Petroleum Institute
(13), and the remaining 1900 from the Mass Spectrometry Data Centre
(14) and the laboratory of Professor Biemann at MIT (15). The
various file generation programs require 6,000 14,000 words of
computer core to run. File generation times vary from about I
minute of cpu time for the generation of the two molecular weight
files up to about 125 cpu minutes to generate the spectrum printout
files. The search system requires 12,000 words of core and most
searches use from 2 - seconds of cpu time, including the searching
and printout and 5 to 15 minutes of elapsed or human time. In
almost all cases, the printout programs require more cpu time than
the search programs.
While the search system has been designed to be used interactively,
it would be possible to change the programs to run in a batch
programming environment, with the ability to enter an entire
spectrum (or spectra from a GC/MS run) and have the program
automatically select the two most intense peaks from every 14 m/e
interval, perform the search, and print out a list of results.
The files used by the search program are all stored on the PDP-10
RPO-2 disk packs and are called into core by individual blocks,
not the entire file. This allows the search system programs to
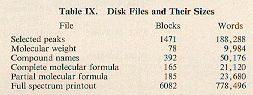
remain small. The sizes of disk files are shown in
Table IX.
The various intermediary files used by the intersection program
require 1-5 blocks. The entire set of files require about 1/4 of
a standard PDP-10 disk pack.
RESULTS AND DISCUSSION
It appears that the abbreviated peak file is a good fingerprint
for retrieving a compound for identification, and a valuable
guide for human interpretation of a mass spectrum. The ability to
sit at a terminal and interact with a highly conversational
program has been found to stimulate the chemist's interpretation.
Clearly, some results found are probably unrelated to the
compound in hand, but their rejection is in itself useful, since
the chemist is now free to consider other alternatives. The
extensive options as to types of searches and options within
searches (e.g., the variable intensity factor) along with the
instantaneous interactive nature of the system, have been found
to make the chemist feel that the system has been written and
tailored to his needs.
As the value of the system depends on the size of the data base,
plans are under way to expand the file. Of even greater value to
the chemist would be the ability to do a partial (or complete)
structure search on the file, rather than a partial or complete
formula search, which is not as specific. For instance, an
ability to find examples of fragmentation patterns for molecules
with the nitrogen mustard group, N--C--C--Cl, might be very useful.
This technique, known as substructure searching, is being
developed in this laboratory both for the Wiswesser Line Notation
(WLN) (16) and the Chemical Abstracts Service connection tables
(17). In the case of the latter type of data base, a computer
search system is under study which will allow for interactive
file searching.
While the search system is small and efficient, the files are
quite large and require a large on-line disk storage capacity,
available at few computer installations. The largest file is the
full spectrum file, containing all the peaks and their
intensities. One possible alternative to storing such a large
file in the computer is to put the full spectrum file in a
microfiche retrieval unit in the chemist's laboratory driven
remotely by the search system program. In such a device, the ID
number would be a pointer to a given microfiche card and page
number, in a manner identical to the pointer system used for the
peak molecular weight, and spectrum lookup disk files described
in the previous section. As the file grows in size, the microfiche becomes economically very attractive compared to the cost
of on-line computer disk storage. Also, the microfiche reader can
be operated manually and used for other storage purposes.
ACKNOWLEDGMENTS
The author wishes to express his appreciation to Richard J.
Feldmann for the extremely efficient intersecting list algorithm.
The author also wishes to thank Henry M. Fates, G. W. A. Milne,
Robert J. Highet, D. J. Pedder, and 1. W. Wheeler for their
generous use and criticism of the search system, and K. Biemann
for the data base.
Received for review March 23, 1972. Accepted June 13, 1972.
Presented in part at the 163rd National Meeting of the American
Chemical Society, Boston, Mass., April 9-14, 1972.
References
(1) B. Pettersson and R. Ryhage, Ark. Kemi, 26, 293 (1967).
(2) S. L. Grotch, Anal. Chem, 42, 1214 (1970).
(3) Ibid., 43, 1362 (1971).
(4) L. E. Wangen, W. S. Woodward, amd T. L. Isenhour, ibid., p
1605.
(5) L. R. Crawford and J. D. Morrison, ibid., 40, 1464 (1968).
(6) B. A. Knock, I. C. Smith, D. E. Wright, and R. G. Ridley,
ibid., 42, 1526 (1970).
(7) H. S. Hertz, R. A. Hites, and K. Biemann, ibid.,
43, 681 (1970).
(8) R. J. Feldmann, S. R. Heller, K. P. Shpairo, and R. S.
Heller, J. Chem. Doc., 12, 41 (1972).
(9) S. R. Heller, DCRT/CIS, "Mass Spectral Search System User's
manual," Division of Computer Research and Technology, Bethesda,
Md, March 1972.
(10) R. Morris CACM, 11, 38 (1068).
(11) Uncertified Mass Spectra, Subcommittee IV, ASTM Committee E-14 (1960).
(12) R. S. Gohlke, Ed. Uncertified Mass Spectral Data, Dow
Chemical Company, Midland, Mich., 1963. Distributed through the
ASTM Committee E-14.
(13) Catalog of Selected Mass Spectral Data, American Petroleum
Institute Research Project 44.
(14) Mass Spectrometry Data Centre, AWRE, Aldermaston, Berks,
England.
(15) Professor K. Biemann, MIT, private communication (1971).
(16) R. J. Feldmann and D. A. Koniver, J. Chem. Doc., 11, 151
(1971).
(17) R. J. Feldmann and S. R. Heller, ivid., 12, 48 (1972).